bomonike
How to capture weather-related readings and display those metrics for your microclimate.
Overview
- Internet Weather
- Local Ambient Weather Instrument
- Maps of Neighborhood Variation
- Trends Over Time
- Home Assistant
- Internet Weather Reports
- Python Program Code
- Latitudes & Longitudes
- Instrument Technologies
- Ambient Weather Instruments
- Weather on Roads in Each State
- DIY Weather Stations
- Cameras
- Weather Prediction
- Weather Forecasts
- Ambient Weather API
Click “OVERVIEW” to minimize the Index
When a local weather station is installed, it needs primary and backup power and additional collector devices such as measurement of solar radiation. Ambient Weather devices have channels 1-8 to which Arduino or Raspberry Pi DIY can be added locally. MAC addresses are used to configure internet to the Ambient Weather Network service which displays a website. There is also local dashboard from a Home Assistant server. In a similar way, external websites display what Inductive Ignition, Palantir, and other enterprise-scale systems built with industrial-strength forecasting algorithms and a wide set of alerts. When alerts are sent to your local Listener service can trigger actuators to take physical action.
Internet Weather
Yahoo’s presentation of weather:
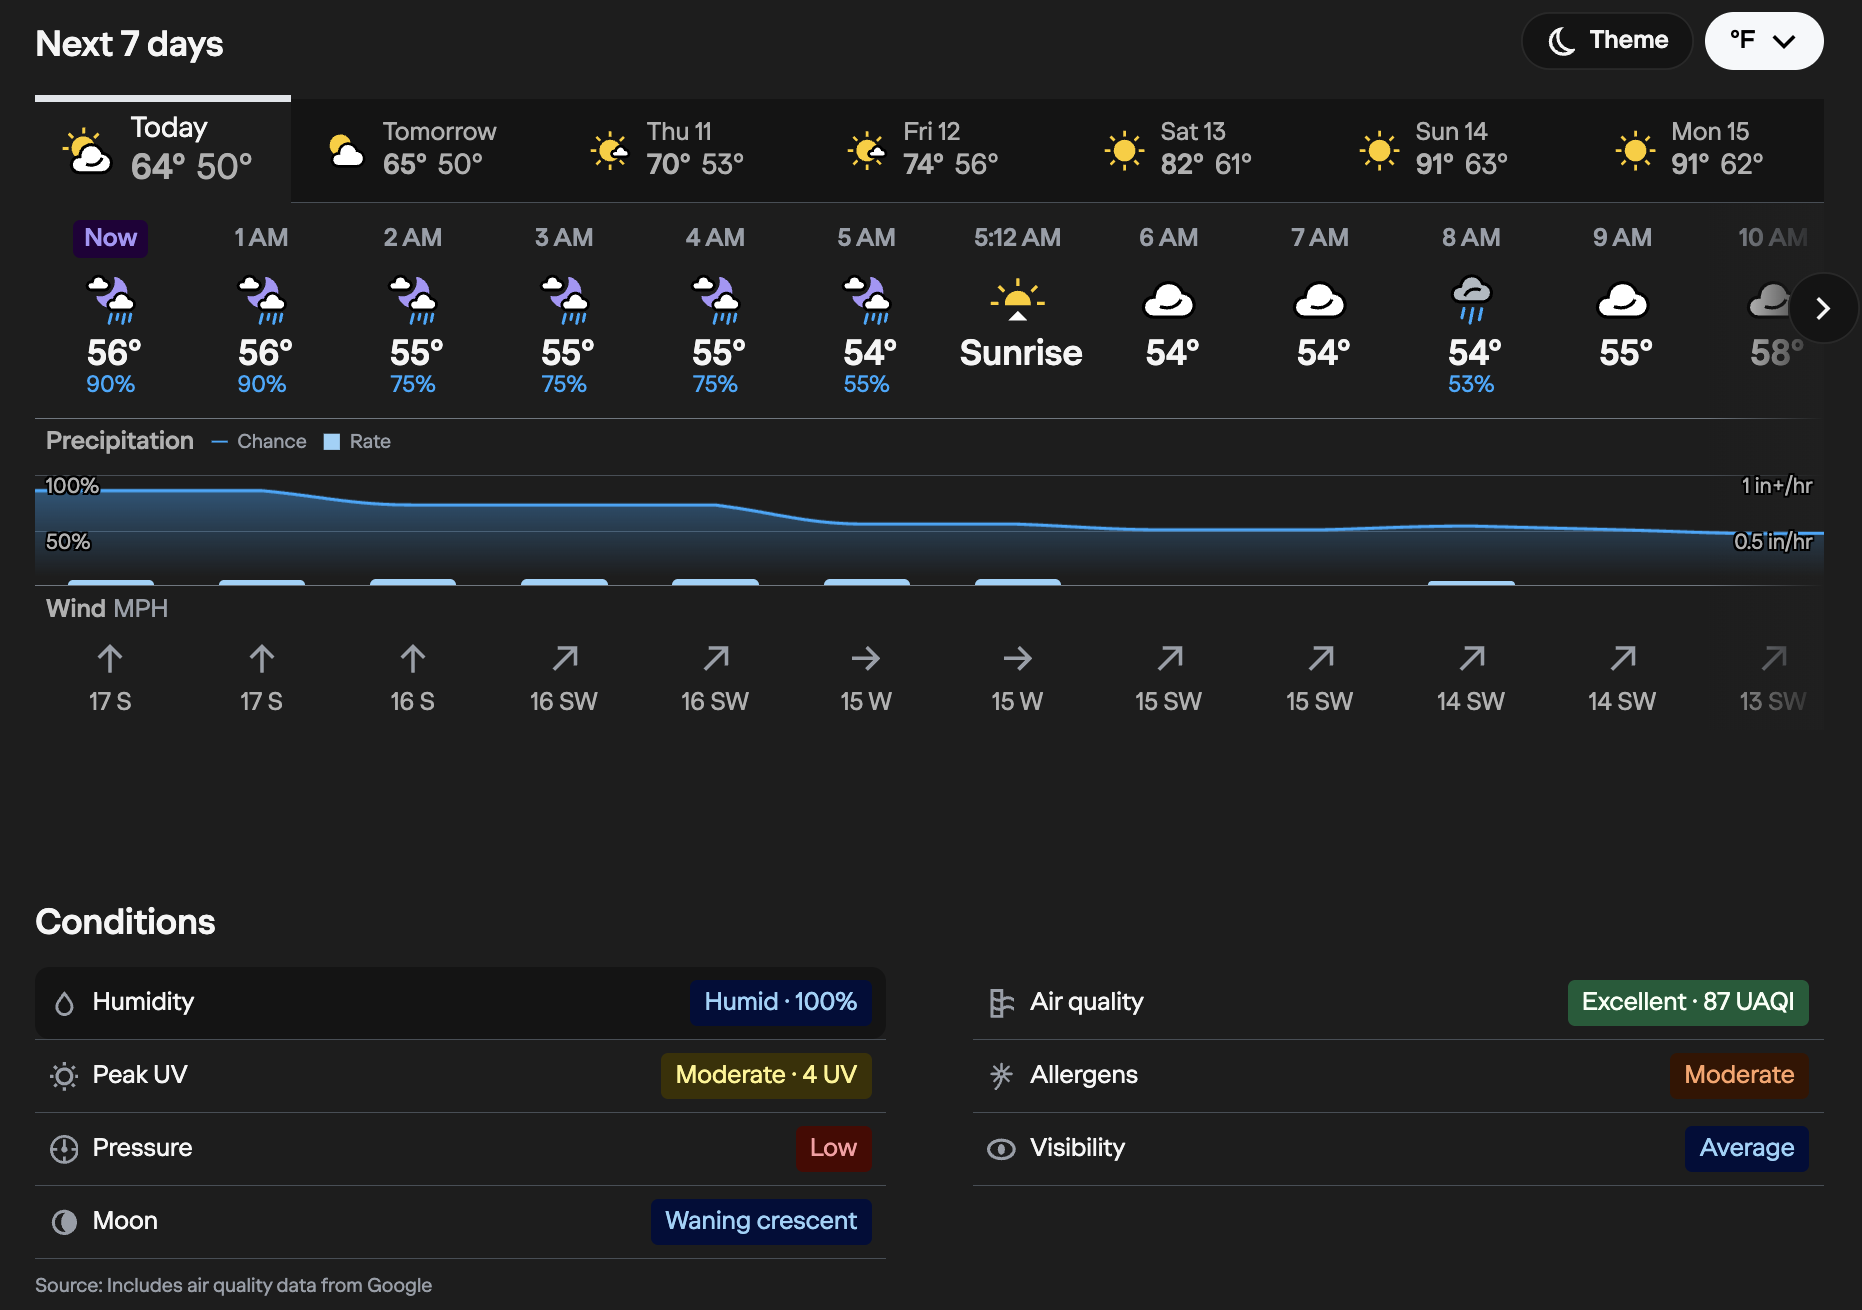
Notice the descriptive English labels to numeric metrics.
Exposure to the external public internet requires a firewall to filter out suspicious senders.
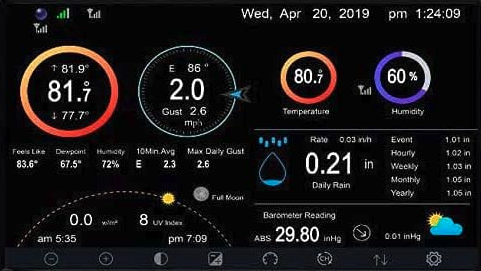
Local Ambient Weather Instrument
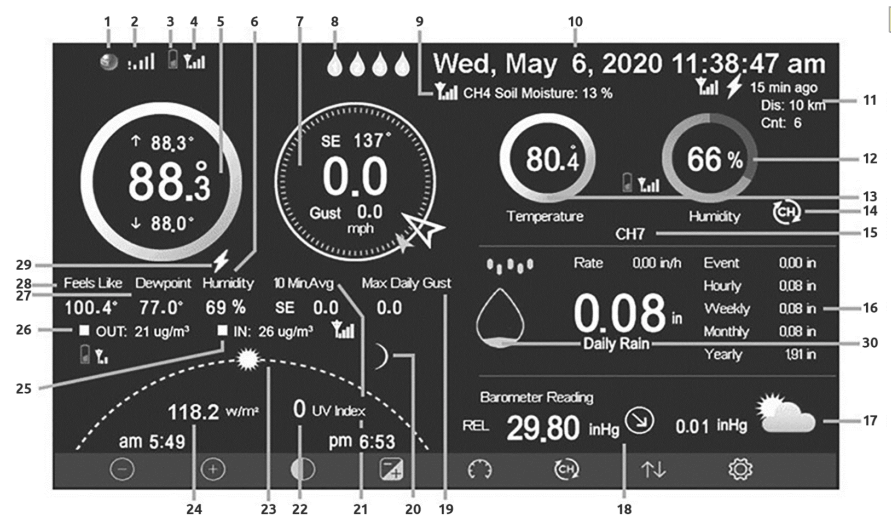
This display above is from the Ambient Weather WS-5000 series after installation/configuration:
(-) and (+) adjust values: Glossary
| (-) Minus Brightness | (+) Plus Brightness Adjust | Backlight On/Off toggle | Background On/Off toggle | Pressure Absolute /Relative toggle | Channel | History | Set Mode |
- The icon is the AmbientWeather.net dashboard for a sample location. (FAQ)
-
Wi-Fi signal strength icon. An exclamation point ! indicates the display is connected to Wi-Fi but not the Internet.
- Outdoor Sensor Array Low Battery Indicator
-
Outdoor Sensor Array Signal Quality
-
Outdoor Temperature (shown with the larger ring) is measured in Centigrade or Fahrenheit by therometers. Above and below the current temp. in large numbers in the middle is the high of the day on top and low temp. of the day on the bottom. The time of day when that’s recalculated can be set in Settings.
The record for the lowest reliably measured natural temperature on Earth is -128.6F (-89.22C) at Vostok Station, Antartica, where people wear jackets (with cayote fur and clumsy zippers) from Canada Goose. VIDEO
-
Humidity is the percentage of water vapor in the air divided by the Dew Point.
A manual psychrometer (aka “sling psychrometer”) uses two thermometers. One has a wet wick around the bulb. The thermometer with the wet wick becomes cooler when water evaporates. The temperature difference on the two thermometers provides the Dew Point.
Manual hygrometers use a polished mirror. As air within the hygrometer is cooled to the dew point, moisture forms on the mirror, which blocks some of the reflected light, indicating that the dew point temperature has been reached.
The Heat Index shows how humidity adds to the danger of high perceived temperature:
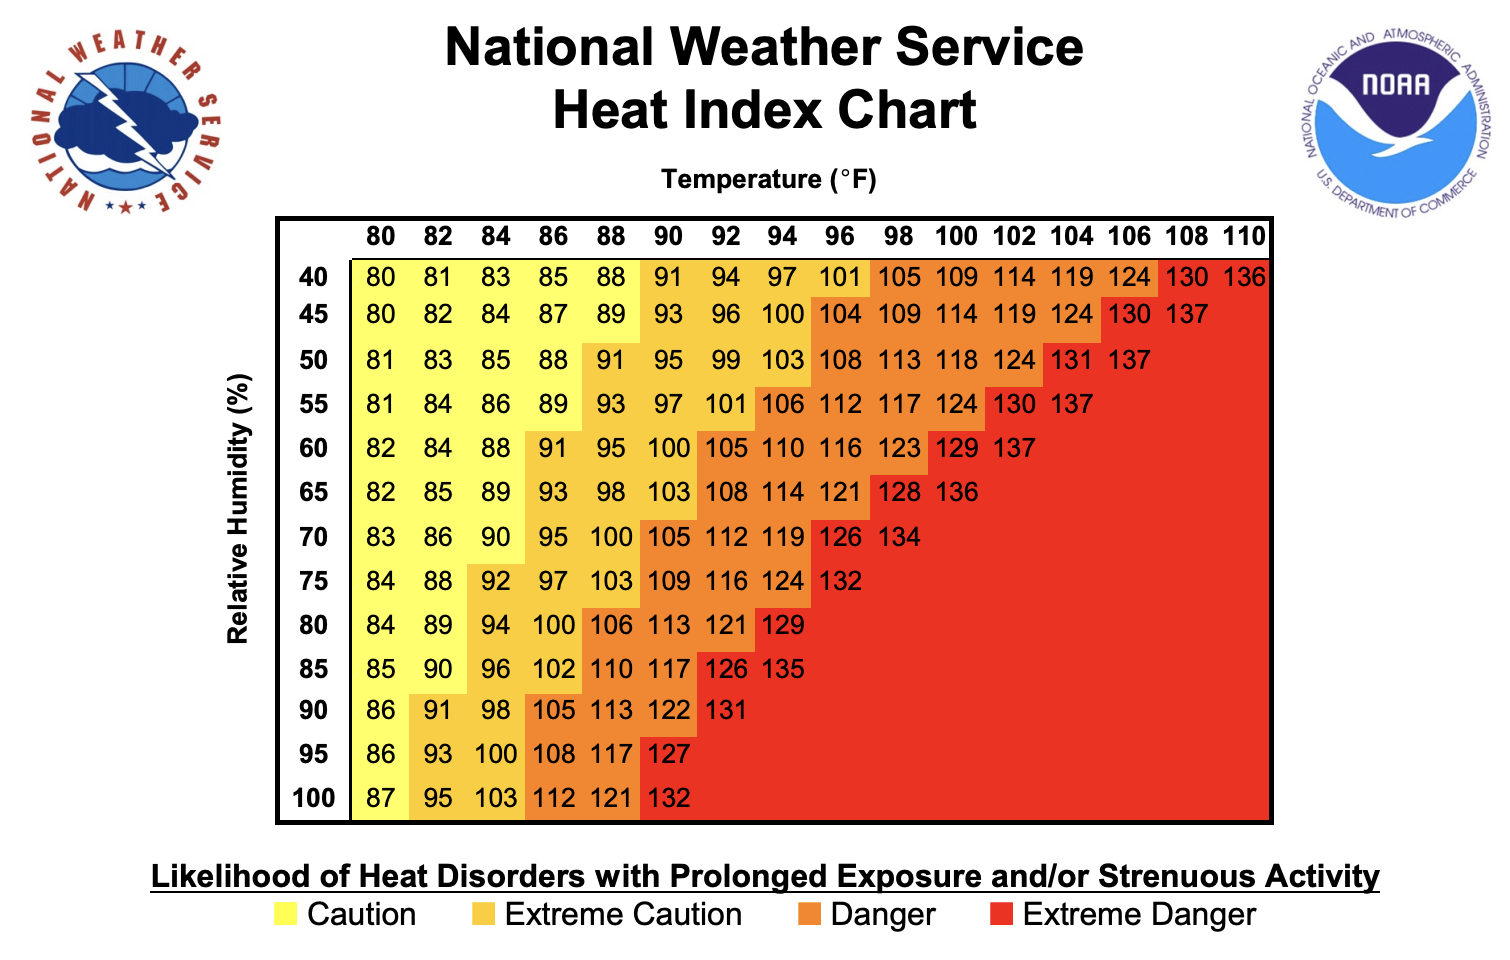
These values are calculated for shady locations only. Exposure to full sunshine can increase heat index values by up to 15°F. Also, strong winds, particularly with very hot, dry air, can be extremely hazardous as wind adds heat to the body. Know Heat Illness Prevention.
“…your body starts to lose the ability to clot @ 95 degrees…”
- Wind:
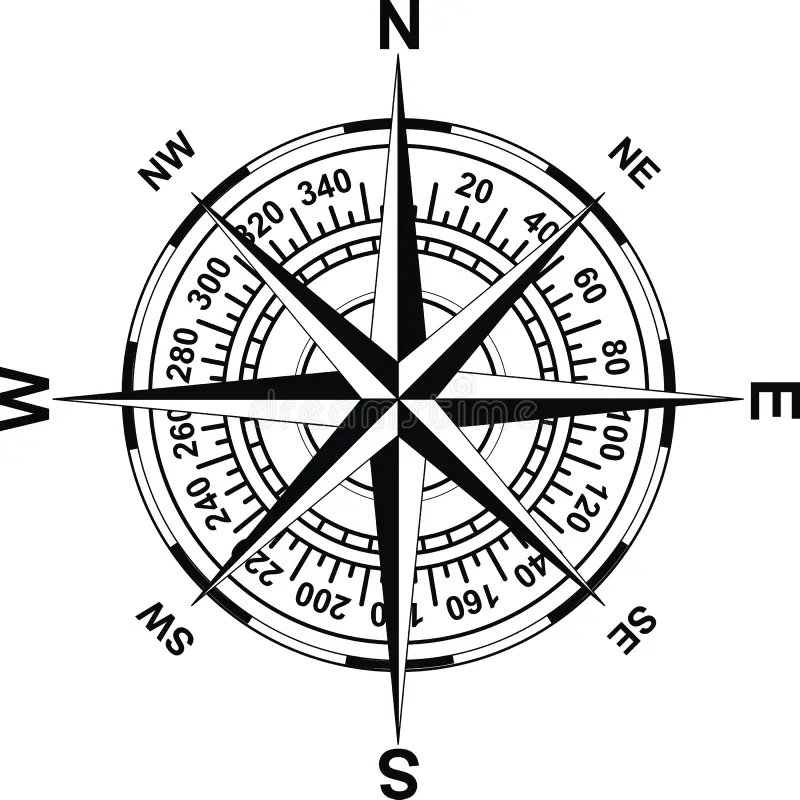
- Wind direction (blue arrow) is measured in compass degrees by wind vanes (looks like an airplane)
- Wind speed and Gust in mph is measured by anemometers within 10-minute average wind direction (larger gray arrow).
- Old anemometers have spinning cups
- New anemometers have ultrasonic technology that has no moving parts.
- Leak detector status (channels 1-4, if installed)
- Soil moisture, leaf wetness CH4 (Channel 4 among channels 1-8 for each of 8 WH31 Temp/Humidity remote sensors that can be added).
- Current date and time
-
Lighting detector last strike, last strike time and strikes per hour (if installed).
Channels
PROTIP: Define you custom list if you install additional detectors:
Indoor
T&H CH1 = Pool (hard-coded)
T&H CH2 = unused
T&H CH3 = unused
T&H CH4 = unused
T&H CH5 = Upstairs freezer
T&H CH6 = unused
T&H CH7 = Downstairs leak detector
T&H CH8 = Downstairs freezer - Indoor, Channel 1-8 humidity
- Indoor, Channel 1-8 temperature from additional instruments such as Ambient Weather’s WH31PF Wireless Waterproof Floating Pool and Spa Thermometer
- CH (Channel) scroll mode indicator
-
Channel indicator.
- Rain icon: maximum is 1.4 inch.
- “Rate”, daily, hourly, weekly, monthly and yearly rain inches
- Forecast icon based on rate of change of pressure
-
“Barometer Reading”: BLOG: Atmospheric pressure is also called Barometric pressure because it’s measured by legacy barometers that measure the compression of mercury due to the weight of air above a square inch. The absolute pressue measured at Mean Sea Level (MSL) is 14.696 PSI (pounds per square) inch of mercury (due to gravity). That’s a constant 1013.25 hPa (hectoPascals) aka “millibars”, also designated as “1 ATM” by the International Standard Atmosphere (ISA) standard. That’s the equivalent of 29.92 inHg (inches of mercury, symbol Hg).
Wikipedia notes that the highest sea-level pressure on Earth occurs in Siberia, where record highs are 1,085 hPa (15.74 psi; 32.0 inHg). The lowest measurable sea-level pressure is found at the centres of tropical cyclones and tornadoes, with a record low of 870 hPa (12.6 psi; 26 inHg). The lowest place on Earth, the Dead Sea at 430 metres (1,410 ft) below sea level, has a typical atmospheric pressure of 1,065 hPa.
CALCULATOR: Temperature and humidity also affect the density of the air, which in turn affects atmospheric pressure. Pressure is proportional to temperature and inversely related to humidity, and both of these are necessary to compute an accurate figure.
Relative (REL) pressure readings decrease as you gain altitude AND as heavier clouds move away. To differentiate between altitude and weather impact, weather reports of locations are normalized relative to sea level. In the US, three digits are all that are transmitted: decimal points and the one or two most significant digits are omitted: 1,013.2 hPa (14.695 psi) is transmitted as 132; 1,000 hPa (100 kPa) is transmitted as 000; 998.7 hPa is transmitted as 987; etc.
REMEMBER: A system transmitting the last three digits transmits the same code (800) for 1080.0 hPa as for 980.0 hPa.
In technical terms, “Atmospheric pressure is thus proportional to the weight per unit area of the atmospheric mass above that location.”
BTW The weight of a column of freshwater of approximately 10.3 m (33.8 ft) is also “one atmosphere” (101.325 kPa or 14.7 psi). Thus, a diver 10.3 m under water experiences a pressure of about 2 atmospheres (1 atm of air plus 1 atm of water). Conversely, 10.3 m is the maximum height to which water can be raised using suction under standard atmospheric conditions.
- “Max Daily Gust” of wind in MPH.
- Moon Phase
-
“10 MinAvg” (10-minute average) wind speed and compass direction
-
“UV Index” (Ultraviolet Index) is measured by a UV meter (if installed).
-
Under arc: am: Sunrise, pm: sunset. On the website is this tile:
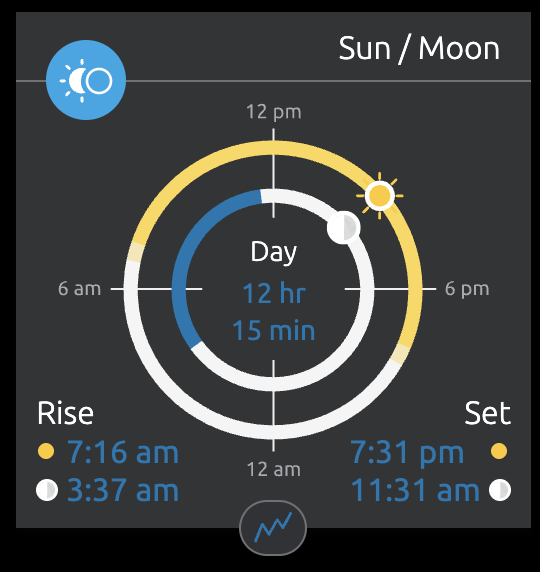
FUN FACT: About 5 minutes is lost or gained each day.
-
Solar Radiation, measured in W/m^2 (Watts per square meter), aka Lux or FC (Foot Candles) by pyranometers that have a dome-shaped sensor that can be seen from all angles, resembling a “UFO saucer”.
The measurement is used to calculate evapotranspiration - the potential for evaporation of moisture from the soil (or the reverse of rainfall) as a function of solar energy, wind, and temperature.
https://power.larc.nasa.gov/data-access-viewer
Solar Radiation is not displayed by default on Ambient Weather’s website. Can it be obtained from API?
Historically, sunshine intensity is measured thru direct solar radiation using pyrheliometers which have a tubular structure that needs to be aimed at the sun, mounted on a solar tracker. BTW Before electronic photoelectric sensors are used by computers, the Campbell-Stokes and Jordan Sunshine Recorders (in the UK) used a glass sphere to focus sunlight onto a recording card replaced each day, creating burn marks that indicate the duration of sunshine that day.
-
“IN “(Indoor) air quality in ug/m3 by PM2.5 & PM1.0 sensors (if the $191.24 Ambient Weather Particulate Monitor AQIN (Indoor Air Quality Index) is configured:
Measure PM2.5 PM1.0 Good 12.0 | 54 Moderate 35.4 | 154 Unhealthy 55.4 | 254 Unhealthy 150.4 | 354 Very Unhealthy 250.4 | 424 Hazardous 500.4 | 604 Alas, air quality is not tracked online.
-
“OUT” (Outdoor) Particulate monitor in ug/m3 by a PM2.5 sensor (if installed)
-
Dewpoint is calculated for measuring the comfort level from moisture in the air. A Simplified version of the Magnus-Tetens Formula is:
AirTemp - ( ( 100 − RelHumidity ) / 5 )
According to NOAA at weather.gov:
At 45 degrees or below, air feels “refreshing”.
At 50, it’s “comfortable”. At 55, it’s “not bad”.
At 60, it’s “muggy”. At 65 it’s “Very Humid”. At 70 it’s “tropical”.Technically, Dew Point is the temperature to which air must be cooled (at constant pressure) in order for it to become saturated (have 100% relative humidity). Dewpoint is the maximum amount of water vapor air can hold at a given temperature. When air cools to its dew point, it reaches 100% relative humidity, and any further cooling causes water vapor to condense into droplets, forming dew or fog.
In other words, “The dew point is the temperature at which a given parcel of humid air must be cooled, at constant barometric pressure, for water vapor to condense into water. The condensed water is called dew. The dew point is a saturation temperature.”
For example, if the temperature is 80 and the dew point 70, the relative humidity is 72%. Much more water is in the air at 100% humidity at a temperature of 70 degrees than at 30 degrees.
-
“Feels Like” will always be cooler than the air temperature because it is calculated based on the impact of wind speed (Wind Chill Factor in cold temperatures) or humidity (Heat Index in hot temperatures) on human skin. high humidity can intensify the sensation of cold by increasing heat loss from your body. Likewise, a cloudy sky prevents sunlight from providing even slight warmth, making the chill feel even sharper. PROTIP: On cold windy days, wear “wind-proof” coats instead of woven sweaters because wind whisks away the thin layer of warm air your body creates to stay cozy, leaving you feeling the full bite of winter’s chill.
- The lightning icon appears when when conditions make it possible for lightning storms to form in the area. The dew point is the temperature at which air becomes saturated with moisture at a given pressure, leading to the formation of dew, fog, or frost. BLOG
- Daily Rain Icon: Rainfall is measured by rain gauges. Modern ones use ultrasonic technology that has less moving parts.
- Tide levels?
- Soil moisture is measured by soil moisture sensors (if installed).
Maps of Neighborhood Variation
This map of temperatue around a location shows the extent of variation among microclimates within just a mile or two – generated by AmbientWeather.net
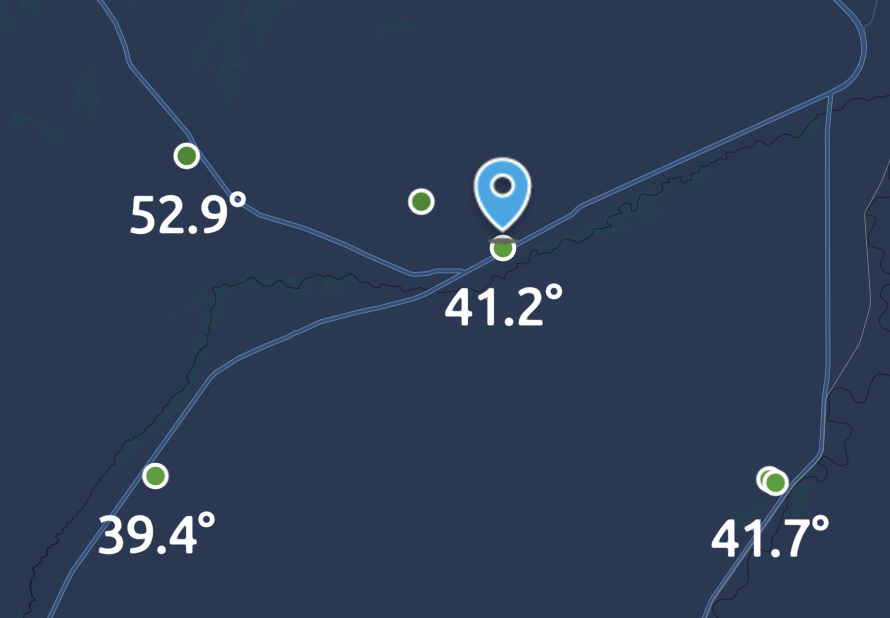
Comparison vs. other weather stations (upwind, downwind, etc.).
Trends Over Time
This meteograph shows the relationship of changes among several metrics over time:
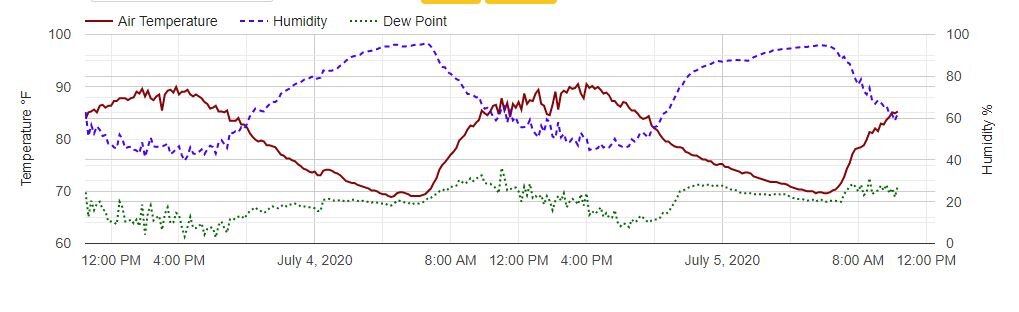
The temperature (brown line) warms up (by the sun) during the day. Temperature cools down at night.
As air cools, humidity (purple line) rises to condensate as morning fog or clouds.
Condensation is likely to occur when the air temperature reaches the Dew point (green line) rises to the temperature when air becomes saturated with moisture (at a given pressure). That’s when rain and snow occurs.
But remember that temperature (brown line) and dew point (in green) change independently of each other. Each can change without affecting the value of the other.
To see metrics over time with multiple metrics overlaid together, click “Graphs & Tables” on the AmbientWeather.net dashboard for a sample location:
- Outdoor temperature, Dew Point, Feels like
- Wind Speed with Wind Gusts overlaid
- Wind direction (toward the direction of the wind
- Daily Rain with Rain Rate
- Relative Pressure: An upward trend indicates a high pressure system moving in with clear skies, while a downward trend indicates a low pressure sucking in bad weather.
- Humidity
-
Sun Height (in yellow line) and Moon Height (in white line)
The highest point is not exactly Noon.
- Air quality with Particulate matter overlaid
- Rain with Snow overlaid
- UV Index with Solar Radiation overlaid
AWN+ subscription unlocks premium features like degree day tiles, enhanced graphing, text alerts, and a 10-Day Hourly Forecast.
Advanced map layers are now free.
d3.js is a JavaScript library for producing dynamic, interactive data visualizations in web browsers. VIDEO
Upwind locations on the map would experience weather patterns (such as rain) before you (n=in a downwind location).
VIDEO: NVIDIA’s Earth-2 family of open models — the world’s first fully open AI weather stack — allows developers, nations, enterprises, and businesses to run application-specific forecasting systems. Their models - Earth-2 Medium Range, Nowcasting, and Global Data Assimilation - move beyond traditional physics-based modeling to deliver faster, more accurate climate insights.
Home Assistant
Home Assistant integration. for smart Home display trends.
Internet Weather Reports
- Ambient Weather has its own cloud (AWN) Network to receive weather reports for its devices.
- https://ambientweather.com/mwdownloads/download/link/id/1223
-
WeatherUnderground.com also accepts video from Ambient Weather AirCams.
- WeatherBug.com (USA)
- pwsweather.com (USA) Weather For You
- windfinder.com (USA)
- wxqa.com (Citizens Weather Observation Program) USA
-
openweathermap.org USA
- wow.metoffice.gov.uk
- awekas.at (Austria)
Python Program Code
I wrote a Python program to retrieve and format weather info from an API calls to openweather.com.
The program makes use of external modules, so can’t be run within ProgramWiz.
So run my program within Google’s Colab like the pros:
- Open a Terminal app.
-
Bring the openweather.py file to the Terminal.
Type an exclamation point character in front of each Bash CLI command such as git.
In Google CoLab???
- To copy a file from your Google Drive:
!cp /content/drive/My\ Drive/Importing\ Scripts\ as\ Modules/utils.py /contentAlternately, you can manually select the file using:
files.upload() - Set permissions:
chmod +x openweather.py - Set .env file containing the API keys ???
-
Because T-Mobile does not correctly identify your physical location, provide your US Zip Code when requesting the weather there:
openweather.py program:
- Execute the program:
!./openweather.py -z 59041The weather service converts your Zip Code to a latitude and longitude:
openweather.org
id: 5661766    at: 06:29 PM (18:29:44) 2025-04-01 TZ: -21600
       Sunrise: 06:55 AM (06:55:20) 2025-04-01 local time
        Sunset: 07:43 PM (19:43:30) 2025-04-01
overcast clouds at Laurel , country=US "lat=45.4959619&lon=-108.9589351"
  Latitude:  45.4959619° North of the Equator &
  Longitude: -108.9589351° East of the Meridian at Greenwich, UK
comfortable Dew Point of 25.78°F vs. 45.91°F at 45% humidity
  Feels like 39.42°F from Wind: 22.01 mph from NNW (313°)
  Visibility to 10000 meters
low -16 pressure at 997 hPa (HectoPascals = 9.97 millibars)
       vs. normal 1013.25 hPa at sea level
                  866    hPa at ground level
VIDEO: Readings from outlying weather stations are combined to provide a more accurate reading. During WWII, the Allies used stations in Iceland, and Ireland to forcast the weather for the Normandie Invasion on June 6, 1944.
Latitudes & Longitudes
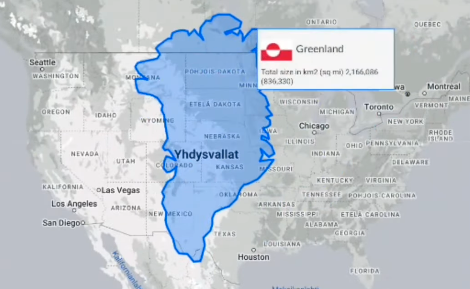
A latitude and longitude make use of the Web Mercator Projection (EPSG:3857) which display spherical forms because it is much simpler to calculate than WGS 84 degrees (EPSG:4326) ellipsoidal datum. Land near the poles, such as Greenland, are distorted and appear larger than VIDEO: when moved to the equator for actual size. Google Maps, which uses it since 2005, cut off coverage at 85.051129° north and south. But the United States Department of Defense through the National Geospatial-Intelligence Agency has declared to be unacceptable for any official use.
Instrument Technologies
There are several technologies to measure your weather:
- Build your own weather station on a Raspberry Pi, ESP32, etc.
Instrument manufacturers:
- AcuRite “fell apart after a year”
- Ambient Weather
- Davis Instruments
- https://www.scientificsales.com/6252-Davis-Wireless-Vantage-Pro2-Weather-Station-p/6252.htm
- The $159.50 Ambient Weather Bridge updates (without the use of a PC or networking fees) weather servers real-time to Twitter, MySQL, EMail Summaries and Alerts, and aircams. See http://www.meteobridge.com/wiki/index.php/Push_Services
Several locally-run servers receive and display weather information:
- The Ignition server
- “Home Assistant”
Ambient Weather Instruments
Ambient Weather is a company that provides weather stations and data for consumer use.
- $449.99 WS-5000 series has WiFi and no moving parts and a TFT color display manual VIDEO User Observations
- $299.99 WS-2000 has WiFi & display
- $144.99 WS-1965 is a entry-level monitor has moving parts.
Other Ambient Weather devices sold separately, with manuals online:
-
$77.99 Network WeatherHub to set up alerts, access your data remotely, and program your home based on weather conditions using IFTTT, Google Home, Alexa, and more. manual http://www.meteobridge.com/ using HTUhttps://angryip.org/download/
- PM25 Particulate Monitor manual
- PM25IN Indoor Particulate Monitor manual
-
AQIN Air Quality Monitor manual
- WH3ILA Leak Detector manual
- WH3ILC Infrared Motion Detector manual
- WH3ILM Lightning Detector manual
- WH315M Soil Monitor Sensor (part of garden bundle) manual
- Pool manual
- AirCam camera for feeding weather websites manual
Weather on Roads in Each State
https://www.511mt.net/#&zoom=5.669649843806675&lon=-110.0832903124836&lat=45.86084166111809
DIY Weather Stations
Others made their own weather stations using Raspberry Pi and other components that include sensors like wind, rainfall, UV Index, Lux Level.
VIDEO:Solar-Powered WiFi Weather Station V20 follows the Book: on Off-Grid Solar Power from Amazon by Debasish Dutta at @opengreenenergy. Features:
- Monitoring Weather parameters like Temperature, Pressure, Humidity, altitude and UV level, etc.
- Connect to Wi-Fi, and upload the data to the web ( Blynk App and Thingspeak)
- Extra ports to add more sensors
- Remote Battery Status Monitoring
- Uses a powerful Li-Ion Battery ( 3400 mAh ) and Solar Panel (1W) for independence from external power source
Customers also bought books by
- Paul Holmes: Off-grid solar power
- Nick Seghers Off Grid Solar Power Simplified: For Rvs, Vans, Cabins, Boats and Tiny Homes
- Caleb Stone The Off Grid Solar Power Bible: [7 in 1] Easy Illustrated DIY Guide + VIDEO COURSE to Safely Install and Maintain your Own Blackout-Free System. Go from Zero Know-How to Zero Electricity Bills.
Cameras
https://www.youtube.com/live/8E84ogCRg8Y&t=1m OpenMV cameras meetup
Weather Prediction
NVIDIA provides a free 3-hour beginner tutorial: “Applying AI Weather Models with NVIDIA Earth-2” to explore state-of-the-art FourCastNet AI weather prediction models and learn how to integrate them into custom workflows.
Weather forecasts suffer from two main sources of uncertainty
- Measurement uncertainty: Observations are sparse and noisy
- Model uncertainty: Models are not an exact representation of reality
This uncertainty is modeled through multiple forecast runs Start from slightly perturbed initial conditions Ensembles of several models allow making probabilistic statements about the future.
In contrast to deterministic forecasts, probabilistic forecasts attempt to model the uncertainty of the future. For weather forecasting, we are facing two main sources of uncertainty. The first one is measurement uncertainty. Weather observations come from weather stations, balloons, buoys, satellites, radar stations, and so on. But these measurements are sparse and not perfect, which introduces uncertainties. The second source of uncertainty are our models, which are not a perfect representation of the physical processes. This is true for both AI and numerical models. Models are used for forecasting but also for assimilating observations into a consistent analysis or reanalysis dataset.
We can make probabilistic statements about the future with the help of ensemble forecasts. Ensembling is a Monte Carlo-like approach where multiple similar but slightly perturbed forecasts are run to produce a distribution of future weather trajectories. For example, if we run 100 forecasts and 23 of these 100 ensemble members predict rain, we can estimate the chance of rain to be 23%. The forecasts cover the same time horizon but are started from slightly different initial conditions. Furthermore, variance is introduced into the forecasting process by either using a probabilistic model or an ensemble of multiple independent models.
Large ensembles are a prime area of application for AI weather models. While numerical systems are usually limited to ensemble sizes of up to 50 or 100 members because of computational constraints, AI systems can easily produce thousands of ensemble members. This makes it possible to characterize high-impact, low-probability events like hurricanes and compound events like heat waves with high humidity.
https://github.com/NVIDIA/earth2studio provides an easy interface for AI weather and climate model inference - from initial testing to projection deployment. It comes with a range of pre-trained models for various applications. Its modular components – data sources, perturbation methods, models, and IO handlers – are combined into custom applications without having to touch any of the other parts.
Forecast Prediction Validation is a transferrable skill: Set up the model, fetch data from sources like GFS, and run deterministic forecasts efficiently.
https://github.com/NVlabs/FourCastNet is a global AI weather model based on Spherical Fourier Neural Operators (SFNO) to create medium-range weather forecasts.
Weather Forecasts
Weather forecasts are indispensable for planning and decision-making in the public and private sector, with weather affecting anything from supply chain resiliency to energy production.
To conduct Monte Carlo probability analysis, we analyze the impact of intentional perturbations. Earth2Studio offers noise-based and model-based perturbation strategies to make this process easier. sample of plausible values
- Noise-based perturbation e.g., Gaussian, Brownian, Perlin, Spherical Gaussian Pure noise generated independent of data Spatially correlated, with “natural” pattern Ideally taking spherical geometry into
- More sophisticated, model-based methods use the forecast model to determine the amount and spatial structure of noise to be added to the perturbed variables. e.g., vector breeding, singular vectors Apply model to unperturbed and noise-perturbed data Iteratively calculate difference, use as new perturbation Identifies variables showing fastest growth/instability
For our exercise, we will perturb initial conditions and skip adding noise to the forecasting process. Initial condition perturbation captures the uncertainty inherent in the measurements and assimilation system. The simpler class of methods adds noise from a defined distribution and of a certain amplitude to some or all of the atmospheric variables.
Downscaling with CorrDiff (and StormCast)
Traditional numerical weather prediction systems are difficult to operate and place heavy demands on time and compute resources. Recent advances in AI weather modeling enable non-expert practitioners to run forecasts tuned to their own needs, validating model outputs, and explore how super-resolution AI models can make fine-grained predictions.
To build a custom AI weather pipeline:
- Learn the fundamentals of AI weather simulation and understand the difference between AI-based and numerical weather prediction.
- Gain hands-on experience running AI weather simulations with Earth2Studio for weather forecasting, historical analyses, and downscaling.
- Get familiar with the individual parts of a weather inference pipeline: Data sources, perturbation, forecast and diagnostic models, and IO handling.
- Validate the skill and calibration of weather forecasts with metrics commonly applied to deterministic and ensemble weather forecasts.
- Build a custom AI weather model inference pipeline, using the example of coupling a global forecast model with a regional downscaling model.
- Combine AI-generated weather data with downstream applications, following examples related to energy demand and production forecasts.
Ambient Weather API
The API (Application Programming Interface) allows programmers to use RESTful interactions in applications.
-
Get the MAC address of your model (such as “12:34:56:AB:CD:EF”) at:
https://ambientweather.com/faqs/question/view/id/1450/
-
Type the MAC address for your account at:
- https://ambientweather.net/devices
- https://ambientweather.net/account
-
Get the AMBIENT_API_KEY value to authenticate all REST API requests.
AMBIENT_API_KEY=1234567890abcdefb642b77c9d2c1b5df497a8c1f44f4b4e8fdf11c002ef2113
AMBIENT_API_KEY grants access to past/present data for a given user’s devices. A typical consumer-facing application will initially ask the user to create an apiKey on their AmbientWeather.net account page (https://ambientweather.net/account) and paste it into the app. Developers for personal or in-house apps will also need to create an apiKey on their own account page.
-
Get the AMBIENT_APPLICATION_KEY to identify the developer / application. To create an application key
AMBIENT_APPLICATION_KEY='your-application-key-here'
-
Enable the Ambient Weather app on your Amazon Alexa devices for its voice-based interactions, such as:
- ”Alexa, ask Ambient Weather for a weather report”
- ”Alexa, ask Ambient Weather the weather yesterday” (a specific day, month or year)
- ”Alexa, ask Ambient Weather for indoor conditions”
However, at time of this writing, one cannot ask:
- … ask Ambient weather the outside temperature”
- … ask Ambient weather the forecast”
- … ask Ambient Weather about today’s rain”
-
Adapt the Python Module for interacting with the Ambient Weather API.
github.com/bachya/aioambient by Aaron Bach is a clean, async-friendly library.
It’s preferred over the
https://github.com/avryhof/ambient_api -
This need not be a var because when it does change, program code will probably need to be tested if not changed as well:
AMBIENT_ENDPOINT=https://rt.ambientweather.net/v1
-
Device Data Specs Wiki lists all the parameters that a device might send.
https://github.com/ambient-weather/api-docs/wiki/Device-Data-Specs
-
Add code in the calling program to account for API requests being capped at 1 request/second for each user’s apiKey and 3 requests/second per applicationKey. When this limit is exceeded, the API will return a 429 response code. Please be kind to our servers :)
API requests are capped at 1 request/second for each user’s apiKey and 3 requests/second per applicationKey. When this limit is exceeded, the API will return a 429 response code. Please be kind to our servers :)
The devices returned from the /devices endpoint contain a lastData parameter that contains the most up-to-date data we have for the device. Most devices update every minute, some update less frequently. The timestamps are rounded to the nearest minute.
Queries for past data using the /devices/:macAddress endpoint are returned in 5 minute or 30 minute increments. There can be up to a 10 minute delay before the most recent data becomes available. If you need up-to-the-minute data please use the /devices endpoint or forthcoming realtime API.
https://ambientweather.docs.apiary.io/# is generated from https://github.com/ambient-weather/api-docs
26-06-09 v047 yahoo @weather-info.md