bomonike
Prometheus logs, metrics, traces faster into a more compact database with built-in GUI instead of Grafana
openobserve.ai (“O2”) is an “Open source observability platform for logs, metrics, traces, frontend monitoring, pipelines and LLM observability.”
g2.com/products/openobserve/reviews shows high 5/5 ratings. Put in a word if you’re familiar with it.
Here’s what makes OpenObserve better and cheaper than Datadog, Splunk, Elasticsearch, Prometheus:
- Being written in Rust enables higher performant alternative
- Rust executables deploy as a single binary (without run-times like Java & Python)
- Runs in Kubernetes from a single Helm chart
- Achieves “140x lower storage” from using new Parquet format data storage.
- Unlike (now “traditional”) Prometheus LGTM which store logs and metrics in different data stores, O2 retrieves them into a “single unified store”
- O2 has a substitute for Grafana dashboard, but still recognizes PromQL (Prometheus Query Language) specs.
Isaac Johnson
presented his large deployment costs vs. competitors GroundCover, DataDog, New Relic:
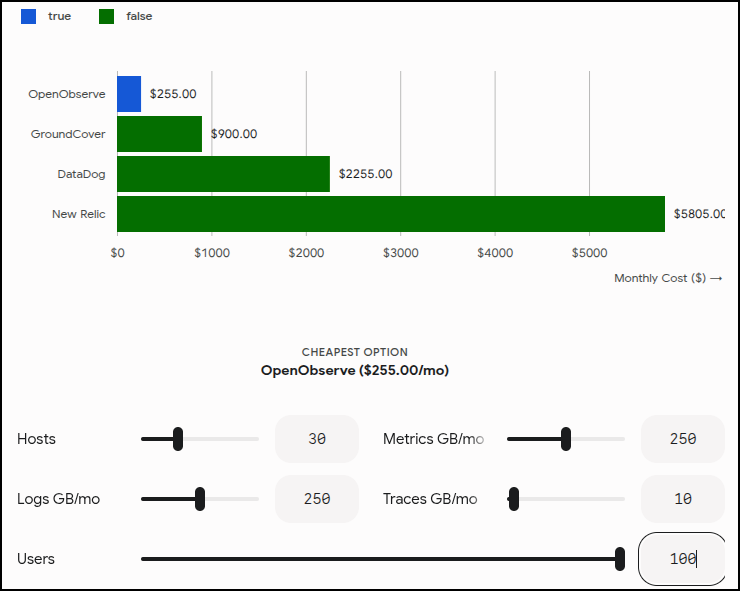
OpenObserve cost $255/mo for 250 GB of logs, 250 GB metrics, 10 GB traces with 30 hosts and 100 users,
Pricing: Enterprise Edition is free continually for up to 50 GB/day (~1.5 TB/month) of data ingestion. But you can exceed your license limit up to 3 times per month before being blocked.
Query is $0.01 per GB with 30-Day Non-metric (Logs, Traces) retention and 15-Month Metrics Retention.
Architecture
-
What does OpenObseve (O2) provide over a traditional observability stack based on Prometheus/Grafana?
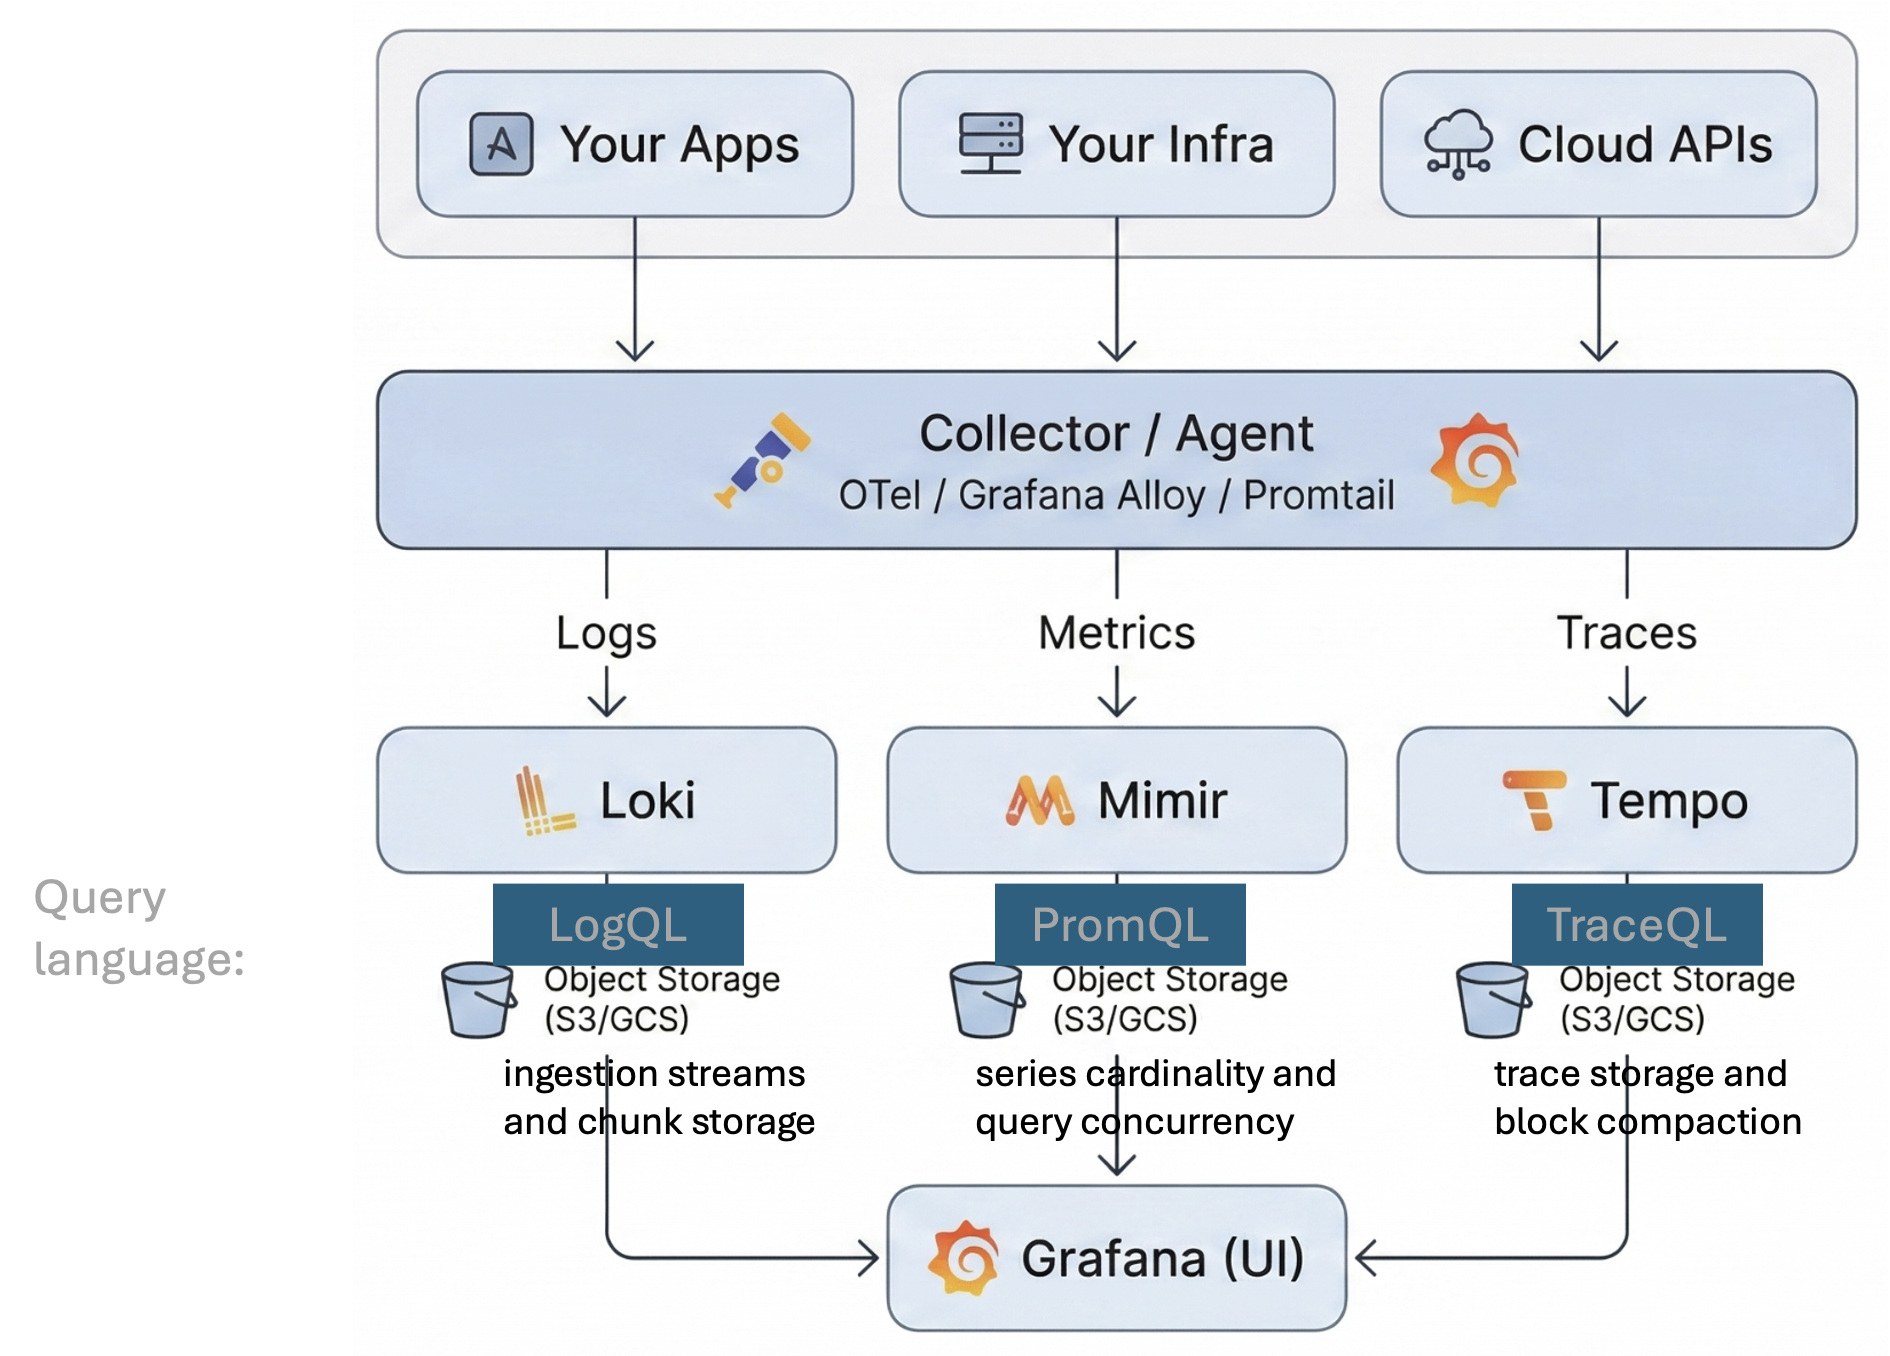
- Instead of a separate Query Language design can run into bottlenecks:
- Loki — bottlenecks on ingestion streams and chunk storage accessed using LogQL language
- Tempo — bottlenecks on trace storage and block compaction accessed using TracQL language
- Mimir — bottlenecks on series cardinality and query concurrency
-
These potential bottlenecks are addressed by the new architecture of OpenObserve’s Unified Agent Ingestion.
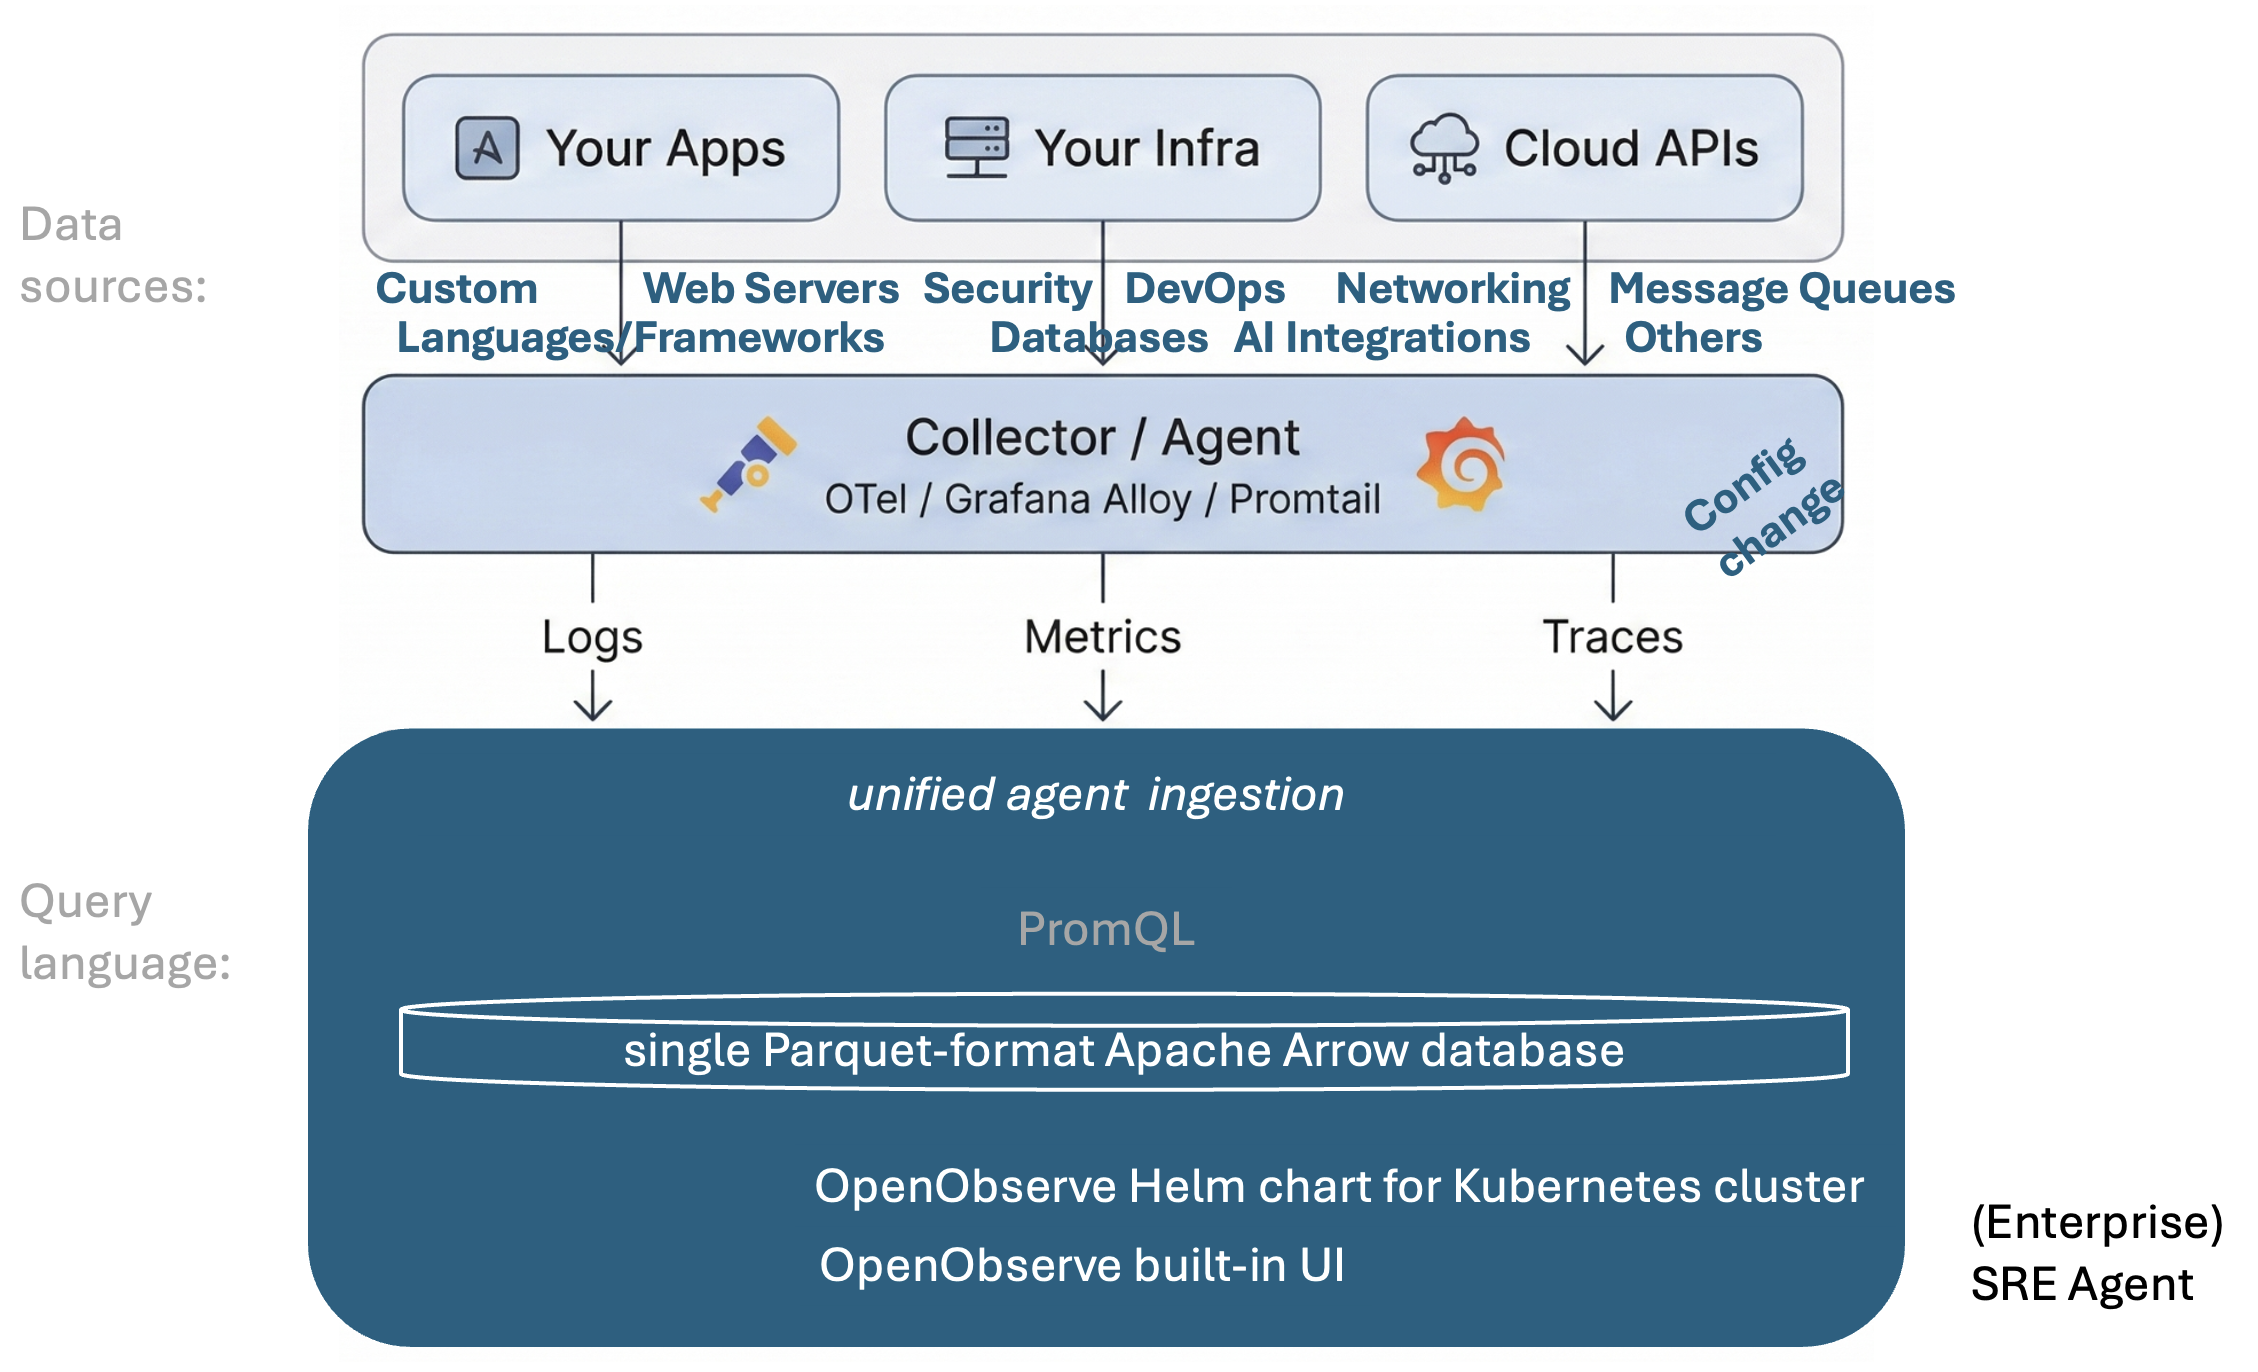
- Instead of a separate Grafana process to manage, OpenObserve provides its own built-in UI, all in a Kubernetes cluster created by a single Helm chart.
- Within the cluster, OpenObserve is able to lower storage costs because it uses a Parquet-format Apache Arrow columnar database
The company
VIDEO: Founder Prabhat Sharma revealed that OpenObserve was rewritten from Go into Rust for higher compression (~40x) using columnar storage with Apache Arrow Parquet SQL to achieve 140x lower storage cost vs. Elasticsearch. * https://www.linkedin.com/company/openobserve/ * https://openobserve.ai/ * https://openobserve.ai/docs/
At time of this writing, their “The Observer” newsletter had 1,737 subscribers from 6,181 followers DelRel:
OpenObserve is open-sourced with a AGPL 3.0 license for local install from:
- https://github.com/openobserve/openobserve
-
https://github.com/openobserve (organization) has 156 repos that include:
- https://github.com/openobserve/playwright-crx
- https://github.com/openobserve/sdr_patterns for Sensitive Data Redaction patterns
- https://github.com/openobserve/openobserve-helm-chart
- https://github.com/openobserve/openobserve-sdk-ios
- https://migration.openobserve.ai/
Quickstart demos
There are three ways to obtain a demo environment installer with credentials baked in, and install locally on a Mac:
- Install Helm on your local machine being observed.
brew install helm
helm version
version.BuildInfo{Version:"v4.2.3", GitCommit:"43e8b7feece8beb0fcba47059ec9b522fd929a64", GitTreeState:"clean", GoVersion:"go1.26.5", KubeClientVersion:"v1.36"} - Install OpenObserve demo locally:
A. Docker demo image download
B. curl and run
C. cloud run
The software is localized in 11 languages: English, German, French, Italian, Japanese, Korean, Dutch, Portuguese, Spanish, Turkish, Chinese (Simplified)
If you have the demo environment already running, go to Run Demo.
A. Docker demo image download & install
- Install Docker Desktop, if you don’t already have it.
- Start Docker Desktop and configure for Kubernetes.
- Download the Docker image:
docker pull public.ecr.aws/zinclabs/openobserve:v0.91.2 - Optionally, get the disk space used by the image:
docker image ls | grep openobserveObserve the “309MB” in the response (at time of writing):
public.ecr.aws/zinclabs/openobserve:v0.91.2 a39535f64535 309MB 0B U
- To run using default email, password, and configurations for a demo baked into the Docker image:
docker run -v $PWD/data:/data -e ZO_DATA_DIR="/data" -p 5080:5080 -e ZO_ROOT_USER_EMAIL="root@example.com" -e ZO_ROOT_USER_PASSWORD="Complexpass#123" public.ecr.aws/zinclabs/openobserve:v0.91.2 20 - Go to Run Local Demo.
B. curl and run demo locally
- Create and navigate to a folder to receive the download, such as “o2”.
-
Switch to an internet browser at: https://openobserve.ai/downloads
- Select Edition: “Enterprise” and Deployment Mode: “Single Node”.
- Click operating system “MacOS”.
- If you want to confirm valid download, double-click the SHA256 UUID to copy to your Clipboard and switch to a CLI Terminal to save it in a file:
export SHA1=$(pbpaste) -
Click the copy icon for the curl command to capture the Quick Install Script into your Clipboard.
REMEMBER: There is not “brew install openobserve” available instead.
curl -L https://raw.githubusercontent.com/openobserve/openobserve/main/downloadO2.sh | sh -s o2-enterprise v0.91.3Observe that the latest version available (v0.91.3 at the time of this writing) has been automatically updated from https://github.com/openobserve/openobserve/releases/
% Total % Received % Xferd Average Speed Time Time Time Current Dload Upload Total Spent Left Speed 100 1445 100 1445 0 0 5023 0 --:--:-- --:--:-- --:--:-- 5034 Detecting platform... Platform: darwin Detecting architecture... Architecture: arm64 Downloading: https://downloads.openobserve.ai/releases/o2-enterprise/v0.91.3/openobserve-ee-v0.91.3-darwin-arm64.tar.gz % Total % Received % Xferd Average Speed Time Time Time Current Dload Upload Total Spent Left Speed 100 124M 100 124M 0 0 10.8M 0 0:00:11 0:00:11 --:--:-- 11.4M Extracting... ✅ Download and extraction complete! - Optionally, generate a SHA256 for the downloaded file and compare versus the previous SHA saved to variable SHA1 :
export SHA2=$(shasum -a 256 openobserve | awk '{print $1}') diff <(echo "$SHA1") <(echo "$SHA2") - Run openobserve for demo purposes using default credentials within the file:
export ZO_ROOT_USER_EMAIL=root@example.com
export ZO_ROOT_USER_PASSWORD=Complexpass#123
./openobserve
SECURITY PROTIP: The above exposes secrets. Instead, during regular/production usage, to protect your password, create a shell file to run OpenObserver after looking up passwords and other secrets from a secrets vault and peform the export.
-
Click “Allow” to the pop-up message “Do you want the application “openobserve” to accept incoming network connections? Clicking Deny may limit the application’s behavior. This setting can be changed in the Firewall pane of Network Settings.”
- Go to Run Local Demo.
C. cloud run your own account
OpenObserve holds its users in several geographic ares within two cloud providers (AWS and Azure). So open a cloud account in AWS and/or Azure using the email you will use with OpenObserve.
-
Switch to an internet browser at: https://openobserve.ai/downloads
-
Click “Log In” to select a geographic area within a cloud vendor (AWS or Azure).
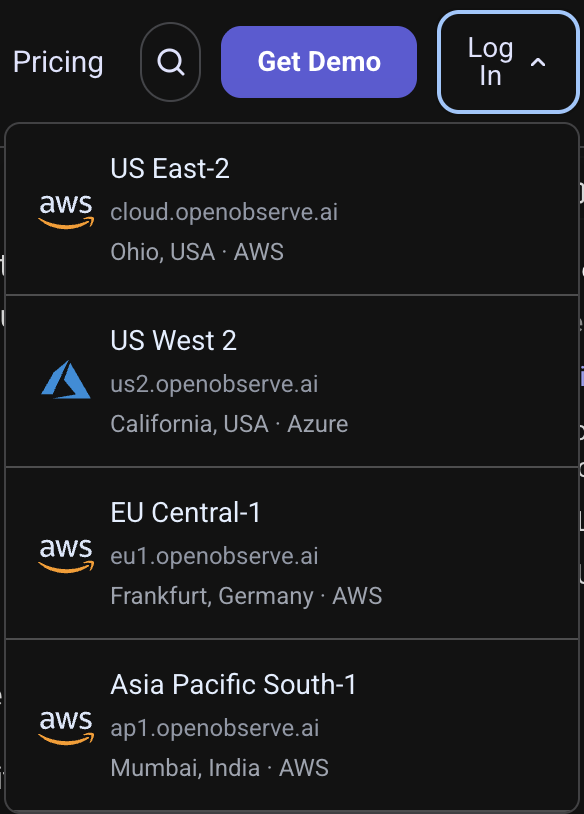
- Provide your cloud email, password, 2FA, and consent for the cloud you selected.
- If you selected Azure, you’ll arrive at https://us2.openobserve.ai/web
-
Click “Start your 14-day Trial”. Note the date in your secrets vault utility.
Observe that no credit card is requested before a subscribing.
- Go to Run Local Demo.
Run Local Demo
-
Switch to an intenet browser to URL: http://localhost:5080/web/login
- Double-click the default User Email and Password baked into the installer and paste to Login:
- User Email: root@example.com
- Password: Complexpass#123
- Follow instructions illustrated at
here
https://freshbrewed.science/2026/07/16/openobs.html#windows-logs
Configure Dashboard
When you’re ready to use your own account:
- Look at the documentation website:
https://openobserve.ai/docs
At the OpenObserve dashboard:
- Click the user icon at the upper-right to “Manage Theme”.
-
Select “Dark”, then “O2 Signature” or your Custom Color. Click “X” to exit.
Menu
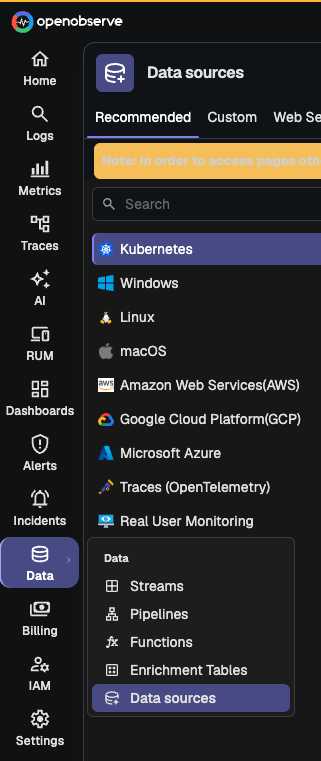
-
Menu items “AI”, “Incidents”, and “Billing” may not appear in your menu.
Organization, Users
- Click the “default” pull down at the top-right. Observe that the URL of the page is the “org_identitifier=” string.
-
Bookmark the URL with the org_identifier.
- Click “IAM” at the bottom of the left menu.
- Click “Organizations” to optionally click the pencil icon to change from “Default” to your preferred name.
-
Optionally, click “New organization”.
- Add User Groups, Users, Roles, Invitations for each organization.
-
CLick “Create New Token” to create an “Ingestion Tokens” for each injestion service.
- Click “Settings” at the bottom of the left menu.
-
Here is where you can delete an organization.
- Click on the left menu any item (“Logs, Metrics, Traces, AI, RUM, Dashboards, Alerts, Incidents, Data”) for “Data sources” to appear.
- Configured Kubernetes to run within
three major operating sytems:
- Windows
- Linux
- macOS
- O2 also runs within the three major clouds:
- Amazon Web Services (AWS)
- Google Cloud Platform (GCP)
- Microsoft Azure
- Configure Traces with OpenTelemetry spans
-
Configure Real User Monitoring (RUM)
Data Sources

These were identified in the Architecture diagram above and documentation at
https://openobserve.ai/docs/ingestion - Configure Data Source for macOS. Click the icon to get the code to “Install the Agent”:
curl -sSL https://raw.githubusercontent.com/openobserve/o2-datasource/main/k8s/install.sh | bash -s -- --cluster-name=cluster1 --o2-url=http://localhost:5080 --org-id=default --access-key=...✓ cert-manager installation initiated ℹ Waiting for cert-manager webhook to be ready (timeout: 300s)...
- Click “Test” button to “Verify Data in OpenObserve”.
- Click “Dashboards” menu, “New Dashboard”, named “???.
- Click “Add panel”. TODO:
Unified Log setting
The unified log is high volume. To reduce it, set LEVEL or PREDICATE in
/opt/openobserve-collector/macos-unified-log.sh
and run:
sudo launchctl kickstart -k system/ai.openobserve.macos-unified-log
Specific O2 Features
-
Click “OpenObserve Features” for this pop-up:
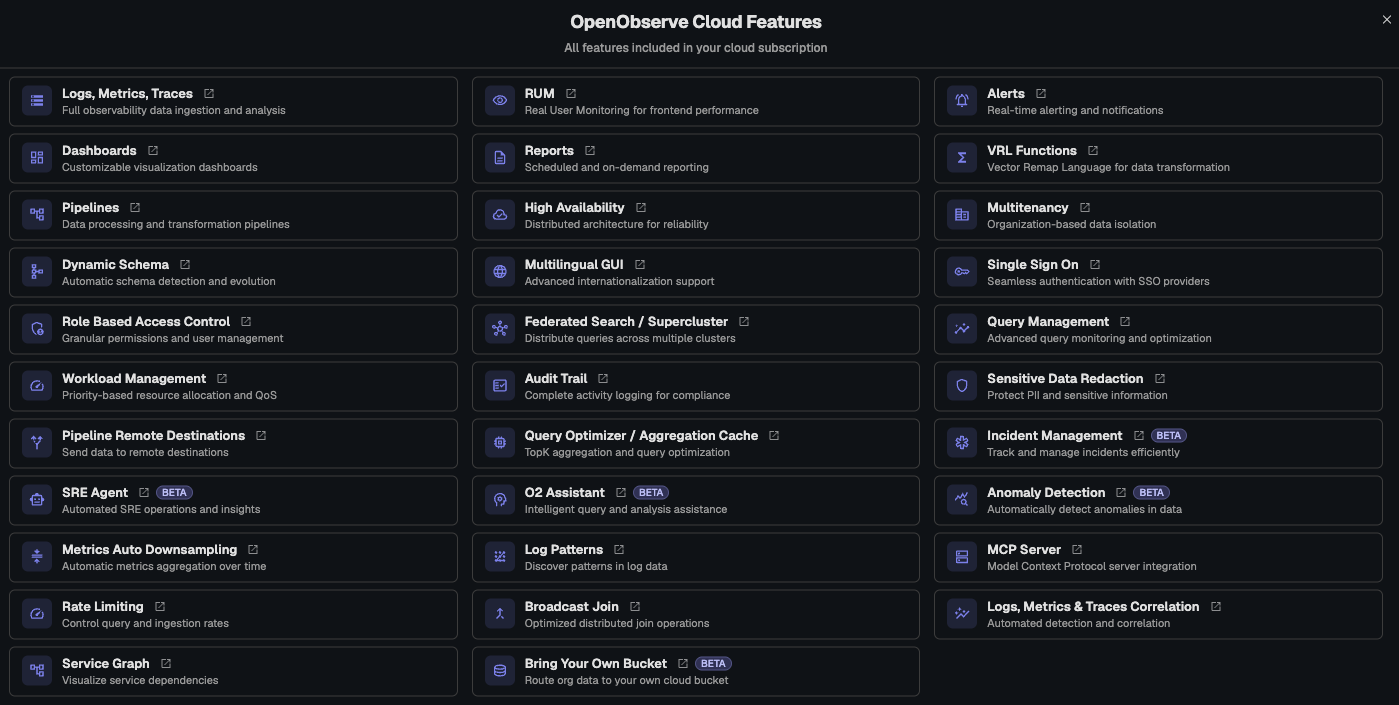
OpenObserver provides access to 30+ prebuilt dashboards to kickoff your observability strategy.
VRL
VRL (Vector Remap Language) is a stateless scripting language initiated by Datadog’s open-source team for transforming and processing observability data (logs, metrics, and traces): parse, filter, enrich, or reshape telemetry events before they reach storage or dashboards.
https://github.com/vectordotdev/vrl is built using Rust as a https://crates.io/crates/vrl
Play on the vrl.dev Playground
https://github.com/vectordotdev/vrl/blob/main/examples/simple.rs
Tutorials
TODO:
References
TODO:
v009 + G2 @openobserve.md created 2026-07-26